It may seem a bit strange but the internal structure of atoms was mostly worked out by studying the light that atoms emit when they are heated or subjected to high voltages when placed in sealed glass tubes under low pressure. So perhaps a good place to start is by having a quick recap on the electromagnetic spectrum you met in your GCSE science course. The electromagnetic spectrum as you may recall includes radio waves, microwaves, visible light, ultraviolet radiation, x-rays and gamma rays; the image below shows an outline of the electromagnetic spectrum, hopefully remember this from your gcse science lessons!

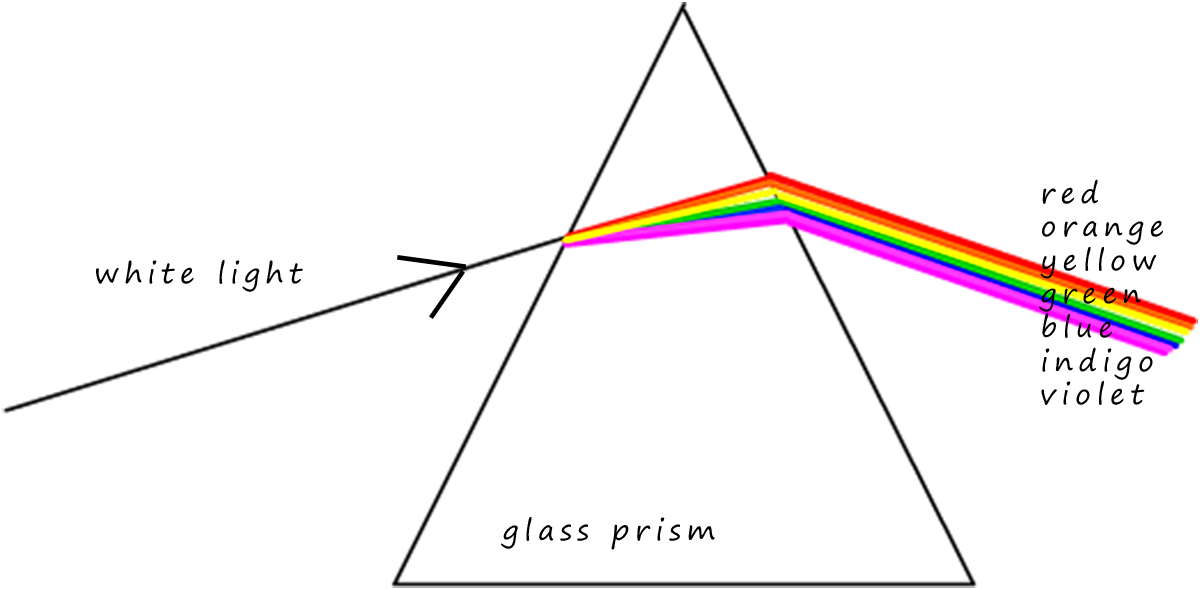
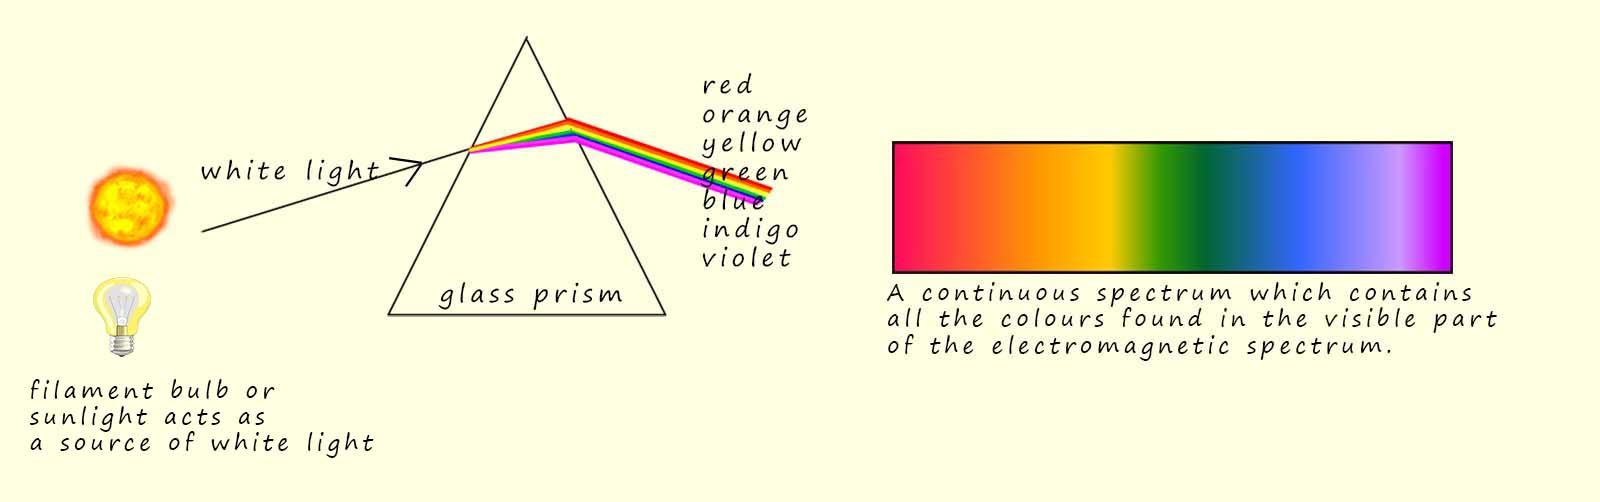
When white light is passed through a glass prism it is split up into its constituent colours and we observe a continuous spectrum of colours from the long wavelength red light to the much shorter wavelength violet light. Sir Isaac Newton performed this very experiment in 1666. You may have carried out a similar experiment in your science lessons using a ray-box and a glass prism as shown opposite.
The spectrum of colours that we see
when white light is split up into its constituent colours is just a
much smaller part of the electromagnetic spectrum. Visible light
consists of a range of wavelengths of
electromagnetic radiation that we can detect with our eyes; these colours are red, orange, yellow, green, blue, indigo and violet (ROYGBIV). The colours of the visible
spectrum are
shown in the diagram below.
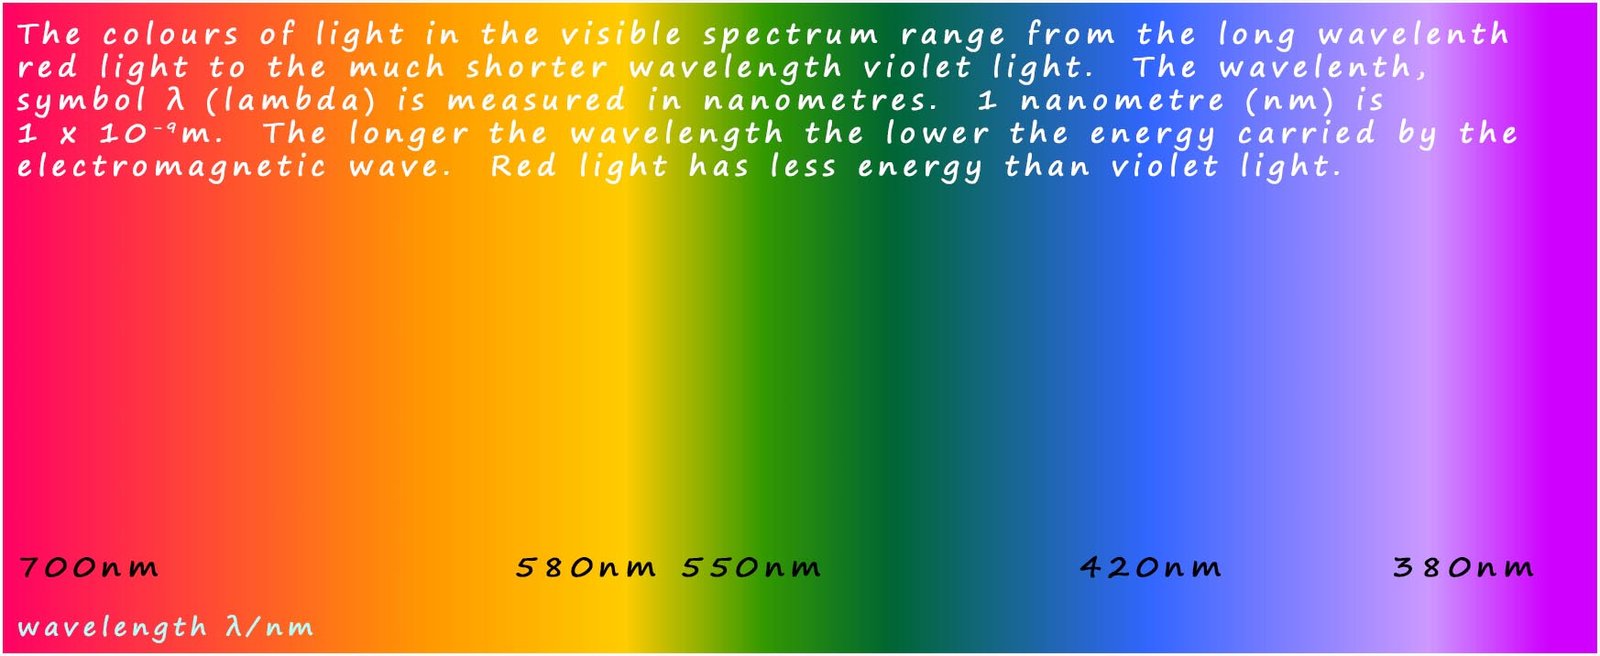
The continuous spectrum of visible light ranges from the low energy long wavelength red light to the higher energy shorter wavelength violet light. Perhaps the most obvious example of the continuous spectrum is the spread of colours that we see in a rainbow.
All electromagnetic waves carry energy from one place to another and are often referred to as radiant energy. Whether the electromagnetic waves are radio waves, microwaves or gamma waves they all have certain common properties; for example they all travel at 300 million metres per second (3 x 10⁸ m/s) in a vacuum. As shown in the diagram above they have wavelengths that cover a vast range; from kilometres in the case of radio waves down to 10-13m for gamma rays. Since all electromagnetic wave move at the same speed the frequency and wavelength are both related through the formula shown below:
Speed = frequency x wavelength
c= ν x λ
If one type of electromagnetic radiation has a high frequency such as gamma rays then its wavelength will be small while radio waves have very long wavelengths but very small frequencies.
Scientists have argued and debated for many centuries on the exact nature of light (electromagnetic radiation); does it consist of a wave or is it made up of a stream of particles. The wave nature of light is evident in phenomena such as interference, refraction and diffraction which are all properties exhibited by waves, such experiments suggest that light can be described by a wave equation, with properties such as wavelength and frequency.
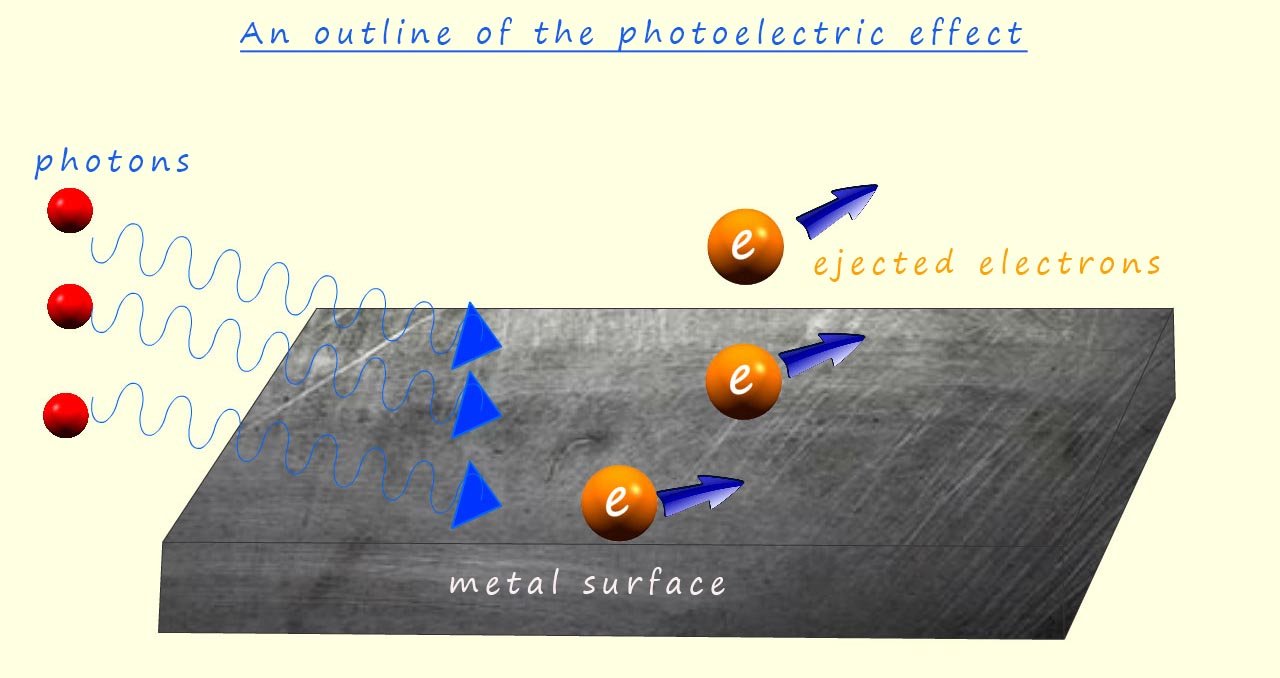 However following the work of scientists such as Max Planck and Albert Einstein a new theory called quantum theory or quantum mechanics was developed in order to try and explain the results and observations from several experiments which suggested that light consisted of particles and not waves. One such experiment; called the photoelectric effect involves shining light onto a metal surface; which then results in electrons being ejected from the metal surface; furthermore the frequency of the light used must be above a minimum threshold value before any electrons are ejected from the metal surface and it should also be noted that the frequency or energy of the light shining needed to eject electrons from the metal surface varied depending on the metal used.
A key observation is that no matter how intense (bright) the light is shown on the metal is; if the frequency is below this minimum threshold value then no electrons are emitted; if electromagnetic radiation (light) consisted purely as a wave the energy delivered to the electrons in the metal would depend on the light's intensity (amplitude) and not its frequency. Therefore, increasing the intensity of light, regardless of frequency, should provide enough energy to eject electrons. This unfortunately is NOT the case.
Secondly the kinetic energy of ejected electrons depends on the frequency of the incident light and not on its intensity. According to wave theory, higher intensity (brighter light) should impart more energy to the electrons, leading to higher kinetic energy in the elected electrons; again this is not observed suggesting that light is not acting as a wave.
While it may seem strange, the exact nature of light (electromagnetic radiation); wave or particle is not determined solely by the experiment itself. Light exhibits wave-particle duality, meaning it can demonstrate properties of both waves and particles but never both simultaneously. It doesn't physically switch between the two; rather the experimental setup can highlight one aspect over the other. This duality is a fundamental principle of quantum mechanics and is essential for understanding the behaviour of subatomic particles. In the following discussion on the emission and absorption spectra of atoms, we'll primarily focus on light's particle nature, considering it as a stream of particles called photons.
In 1911 the model of the atom which existed was based on Rutherford's nuclear model of the atom. Ernest Ernest had just discovered the nucleus following his now famous "gold foil experiment" but Rutherford's model of the atom; which replaced J.J. Thomson's plum pudding model said very little about how the electrons were arranged inside the atom. Rutherford's nuclear model of the atom established the nucleus at the centre of the atom but it lacked specifics about the electron orbits. The electrons, with their negative charge were simply described as orbiting the nucleus at a distance, much like planets around the Sun; Rutherford didn't define:

In 1913 when Niels Bohr suggested that the electrons within atoms orbit the nucleus in circular or elliptical orbits and these orbits have fixed or discrete energy levels, that is the electrons can only orbit the nucleus in these stable discrete energy levels, another way of putting this is that the energy of the electrons within the atom is quantised or fixed to certain allowed energy levels and it cannot have a continuous range of values, as a simple analogy consider climbing a ladder; as you climb the ladder you gain gravitational potential energy in fixed amounts corresponding to which step you are on, you cannot for example be on step 1.5 or step 93/4, this means that you cannot have any value or amount of gravitational potential energy but only certain fixed discrete values; that is your gravitational potential energy is quantised.
Now when an atom absorbs electromagnetic radiation the electrons within the atom gain energy and jump to a higher energy level, these electrons are described as being excited or in an excited state, however the electrons do not stay in this excited state for long and very quickly drop back down to a lower energy level and in the process they will emit energy. What is crucial that the electrons will only absorb or emit energy if it exactly matches the difference in the energy levels within atoms, it is a little like the ladder analogy; you can only go up and down the ladder by using the steps, similarly in the atom the electrons can only gain and lose energy as they move from one energy level to another. The difference in energy (ΔE) between the two energy levels in the electronic transition is simply found using the equation below:
ΔE = (energy of higher electron shell) - ( energy of lower electron shell)
Or
ΔE= energy of the electromagnetic radiation released by the atom
When the electrons inside the atom absorb or emit energy; the energy will be transferred as a stream of particles, called photons. Now as discussed above if these photons contain the correct amount of energy the electrons present in atoms will absorb this energy and they become excited and jump to a higher energy levels or shells inside the atom. In the diagram below an electron jumps from the ground state or first energy level up to the third energy level. In order to make this jump from the first energy level to the third energy level the supplied energy from the photon must match exactly the differences in energy between the two energy levels.
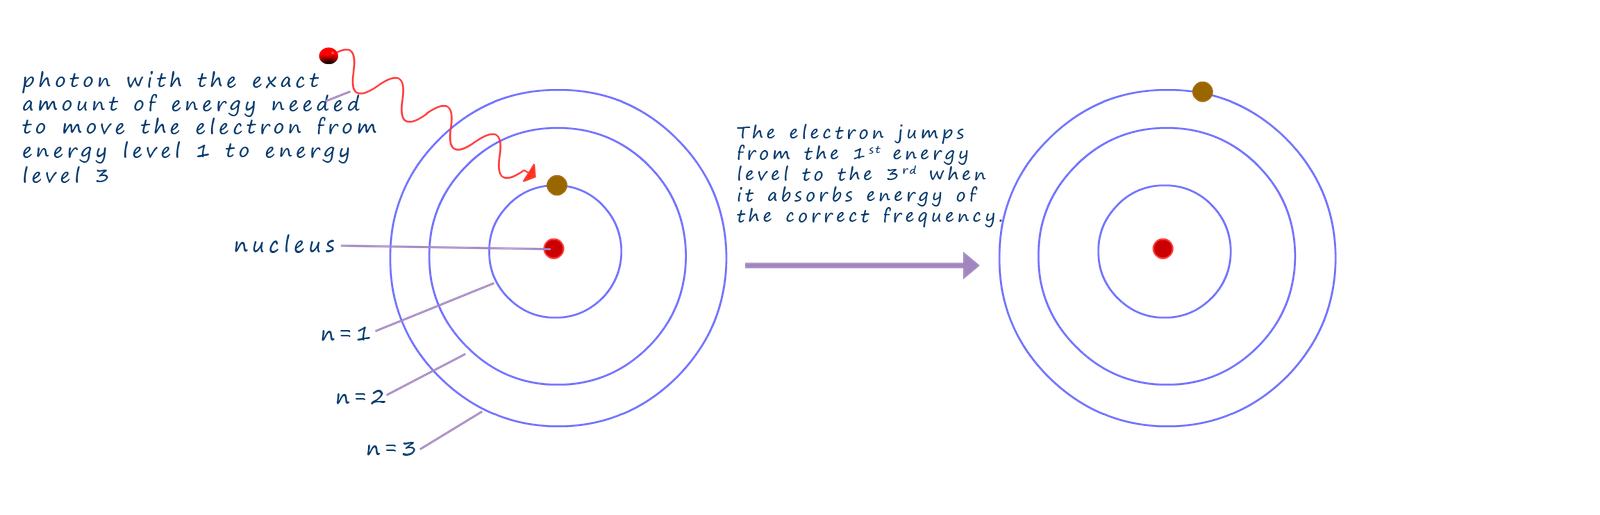
This idea that electrons can absorb energy when they are excited by heating or applying a high voltage across atoms and jump to a higher electron shell or energy level then simply release this same "packet" or photon of energy when it drops back down to a lower energy level may seem fairly simple and obvious to you but it is in fact one of the foundations to understanding absorption and emission spectra.
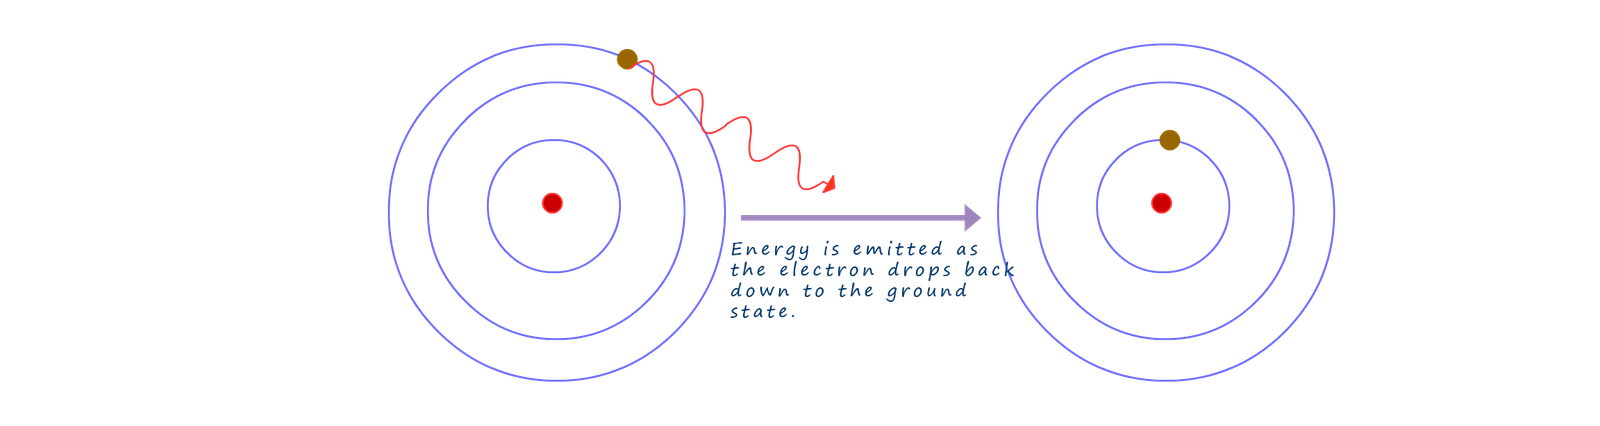
When the electrons gains energy and move to higher energy levels it does not remain there for very long and will very quickly drop back down again into a lower energy level and as it does it will release a photon or packet of energy. When the electron returns back to the ground state the energy it gained is emitted as electromagnetic radiation, usually visible light, infrared or ultraviolet.
The amount of energy lost or gained by an electron as it moves from one energy level inside the atom can be found using the Planck equation shown below:
Energy = Planck's constant x frequency
E = h x ν
Here E represents the energy of a single photon; h is Planck's constant which has a value of 6.63 x 10⁻³⁴Js and the Greek symbol nu (ν) represents the frequency of the emitted radiation. From the Planck equation we can see that the higher the frequency of the electromagnetic radiation emitted or absorbed by the atom the more energy it will emit or absorb.
Plancks's constant has units of Joule seconds, however in chemistry we usually use kilojoules (kJ) when discussing energy changes; so any value obtained using Planck's equation will need to be divided by 1000 to convert the answer obtained into kilojoules. Planck's equation will give the energy of a single photon and again since energy changes are usually measured in kilojoules per mole (kJ mol-1), this means we to need adjust Planck's equation as shown below by including the Avogadro constant.
Energy = (Avogadro's number x Planck's contant x frequency)/1000
E = (L x h x ν)/1000
Her L is the Avogadro constant which has a value of 6.022 x 10²³ and using this equation will give any calculated energy absorbed or emitted by 1 mole of photons in units of kJ mol-1.
When white light from the Sun or a filament bulb is passed through a glass prism a continuous spectrum is produced which contains all the colours found in the visible spectrum, this is outlined
However if the white light from the bulb or the Sun is passed through a gas such as hydrogen before it enters the glass block then this time the spectrum produced has several black lines present in it, the gas present in the sample is absorbing some of the wavelengths of light from the continuous spectrum. The spectrum produced is called an absorption spectrum, this is briefly outlined in the image below:
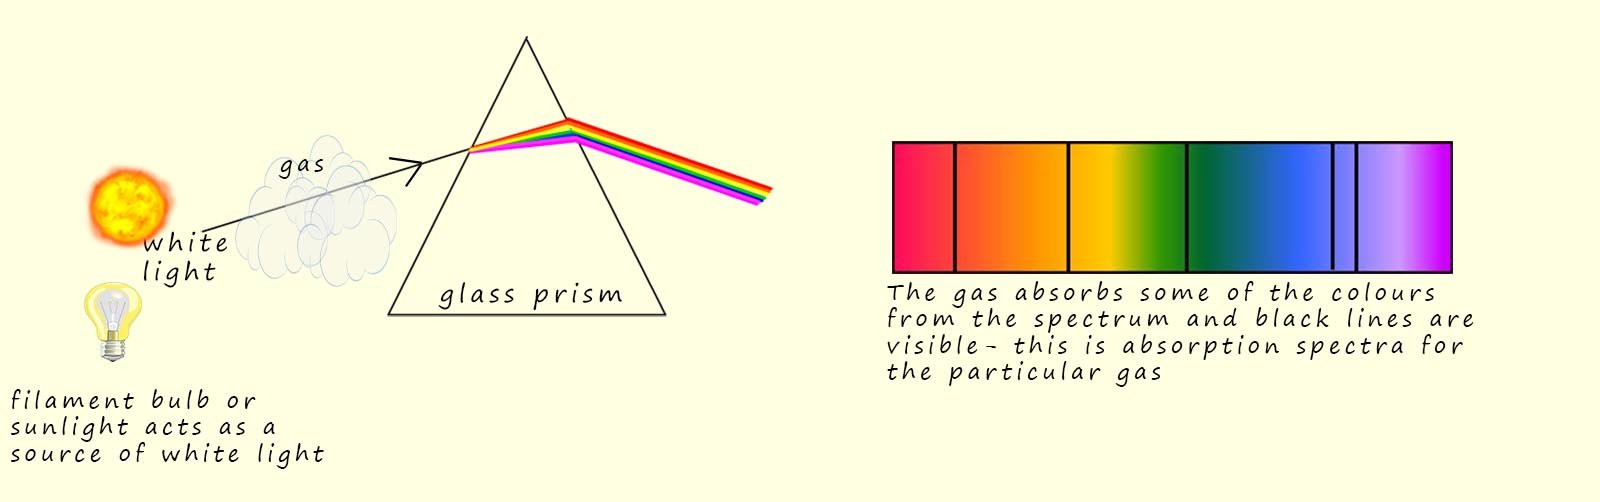 So why are there dark lines present in the spectrum? Well the electrons present in the gas sample will absorb certain wavelengths or photons of light with specific energies, that is energies that will enable them to jump to higher energy levels within the atom. Now it is important to realise that only photons with the exact energy required to promote the electrons to the higher energy levels are absorbed.
 The missing wavelengths that correspond to these energy values are the only ones that are absorbed from the continuous spectrum and these missing wavelengths show up as dark lines. Since each element absorbs different wavelengths of light the position of the black lines act like a fingerprint for that particular element.
The absorption spectrum shown above only shows the visible part of the electromagnetic spectrum and it is important to realise that wavelengths outside of the visible spectrum are also absorbed, but obviously they will not be visible to our eyes.
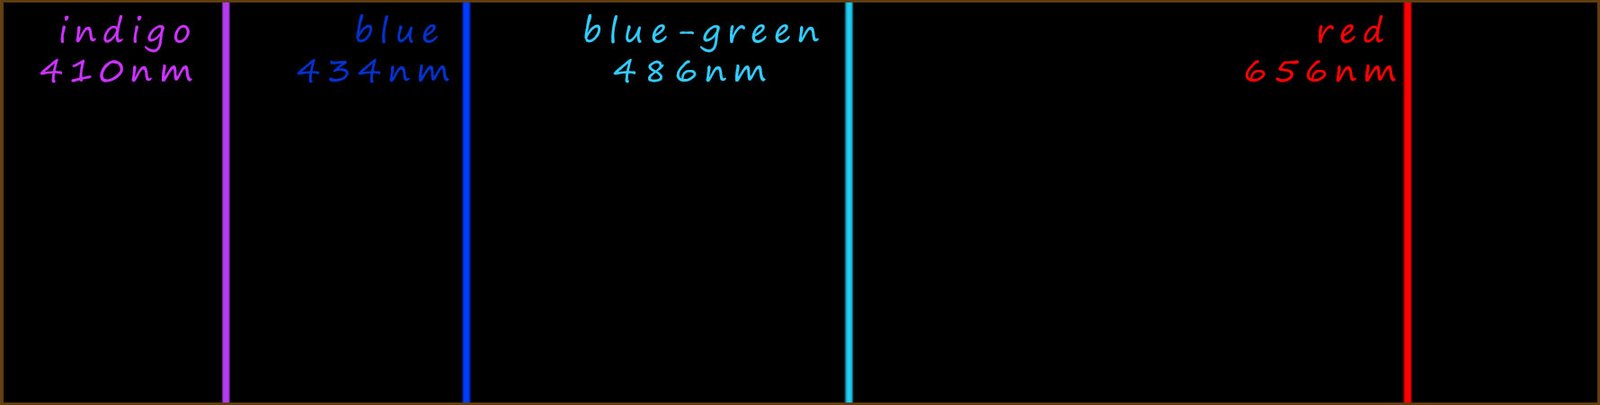
When gases are sealed in glass tubes under reduced pressure and large voltages are applied across the gas then the gas will glow and emit coloured light. You will have seen this phenomenon for example when neon and some other noble gases are used in advertising signs above many restaurants and bars. When light from these glowing gas filled tubes is passed through a glass prism then only a few lines of coloured light are produced; with each line having its own unique wavelength or frequency. The spectrum produced is called an emission spectrum or a line spectrum and each one is unique for each individual element. This is in fact one of the ways in which astronomers are able to identify the elements present in stars. The diagram below shows the visible part of the emission spectrum for hydrogen gas

Now the 4 coloured lines present in the emission spectrum for hydrogen are the same 4 dark lines that appear in the absorption spectrum of hydrogen as shown below:

Let's now look at the emission spectrum for the simplest element hydrogen in a little more detail. Johann Blamer a Swiss school teacher noticed in 1885 that the emission spectra of hydrogen contained 4 lines in the visible part of the spectrum. These 4 lines with their corresponding wavelengths (λ) are shown below:

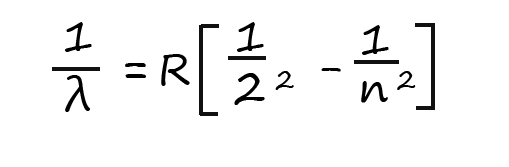
Here the Greek symbol lambda (λ) represents the wavelength of the visible light released and R is a constant called the Rydberg constant (R=1.097 x10⁻² nm-1) and n is simply the electron shell numbers or principal quantum number (n). All the transitions in the visible part of the emission spectrum for hydrogen are as a result of an electron losing energy and falling down to the second energy level, n is the starting electron energy level in the hydrogen atom which must have a value of more than 2.
So for example the red line in the hydrogen emission spectrum at 656nm (nanometres) is due to an electron losing energy and dropping down from the third energy level to energy level 2. If we substitute these values into the Balmer-Rydberg equation we should be able to show that the red light emitted does indeed have a wavelength of 656nm; this calculation and also the one to calculate the wavelength of the blue light emitted is shown below:

You can check the other values for the wavelengths produced in the line spectrum by simply substituting the other values for the electron transitions into the Balmer-Rydberg equation The line spectra for hydrogen also has other lines present in the ultraviolet region (called the Lyman series) and the infrared region (called the Paschen series); both these series were named after the people who discovered them. Ultraviolet radiation being of shorter wavelength and higher frequency than either visible light or infrared has a much higher energy than both of these electromagnetic waves. The transitions for each of these series are shown in the diagram below:
